Orchard Notes: August 2023
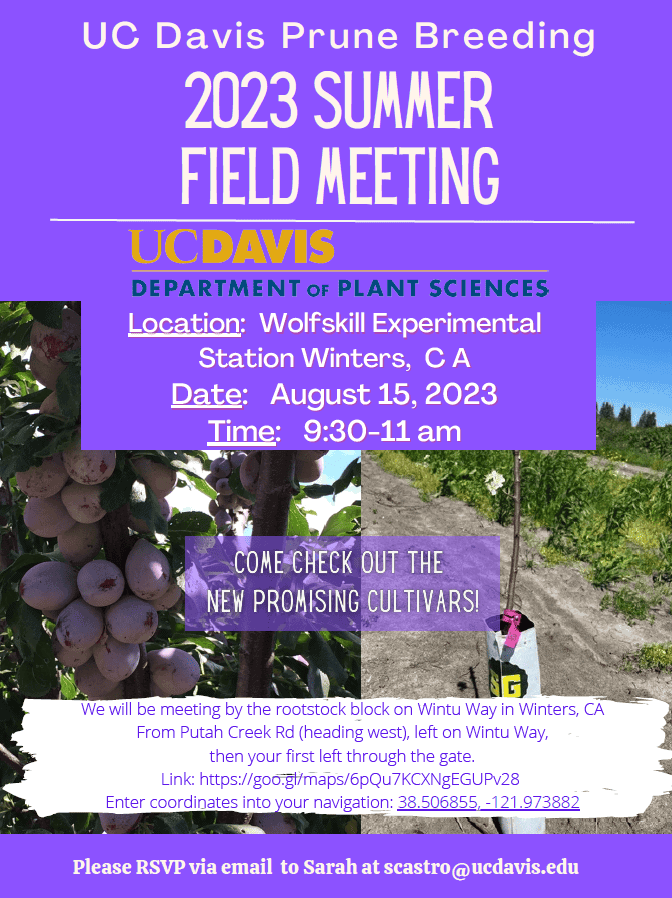
WOLFSKILL SUMMER FIELD MEETING
GETTING THE BEST GROWER RETURNS AT HARVEST
Franz Niederholzer, UCCE Farm Advisor, Colusa and Sutter/Yuba Counties
Luke Milliron, UCCE Farm Advisor, Butte, Glenn, and Tehama Counties
Richard Buchner, UCCE Farm Advisor Emeritus Tehama and Glenn Counties
Adapted for 2023 harvest by Becky Wheeler-Dykes, UCCE Farm Advisor, Glenn, Tehama and Colusa Counties
With high fruit sets and good growing conditions in 2023, maximize grower income by focusing on harvest timing and field sizing. The keys to a timely harvest are 1) get the largest, high-quality fruit to the dryer and 2) field sort to keep small, low value fruit out of the bins.
Harvest timing:
Properly timed harvest delivers the best grower returns and best quality fruit to market. Fruit in an orchard is mature and ready to harvest once average internal pressure drops below 4 lbs.
Early harvest: shaking when the average pressure is more than 4 pounds “leaves money on the tree”; the fruit isn’t finished putting on dry weight. Shaking late, when the fruit is very soft, risks crop loss if winds pick up and ripe fruit drops to the orchard floor (early drop). The target start time is 3 to 4 lbs internal pressure. Each week, fruit pressure generally drops 1.5 pounds pressure (faster rate in cool weather, slower rate in hot weather) and sugars increase around 2%. Sugar increase occurs by fruit dehydration (concentration) once the fruit is mature (internal pressure is in the 3-4 lb range).
The following are UC recommended steps to measure prune fruit maturity:
- Sample 25 fruit from the block by sampling five fruit from five trees. Take fruit from the inside and outside of the canopy. Flag the trees so that the same trees will be used each week.
- Slice the skin off the fruit “cheeks” on both sides of each fruit. Just remove the skin, take as little flesh off as possible. *Save the fruit for sugar testing after pressure testing as described below.
- Measure fruit firmness on each cheek using a “fruit pressure tester” with a 5.16” tip.
- Calculate the average pressures per fruit and record that number. Then, calculate the average fruit pressure for the block. Use the average fruit pressure to determine harvest timing but watch for very low pressures that might indicate early drop of some fruit.
- Track fruit pressure each week to determine harvest timing.
- PRUNES ARE MATURE BETWEEN 3-4 POUNDS PRESSURE. When timing harvest start, growers must consider the number of acres to shake, available dryer space, tree age/cropload and fruit pressures in each block. For example, it may be better to start early in the youngest orchard with a light crop and high sugars and then move to older, heavier cropping orchard with lower sugars afterwards. This gives the older block a few more days to improve sugar level.
Field sizing:
Small fruit (C screen or smaller) are worth less than A and B screen fruit but maximizing large fruit production (and net grower returns) means growing some small fruit. This likelihood is even higher in 2023 with such heavy crop-loads. We recommend growers take time and estimate dry fruit size ahead of harvest to help with field sizing decisions. Each grower must make their own decisions based on the crop in their orchard and pricing information from their packer.
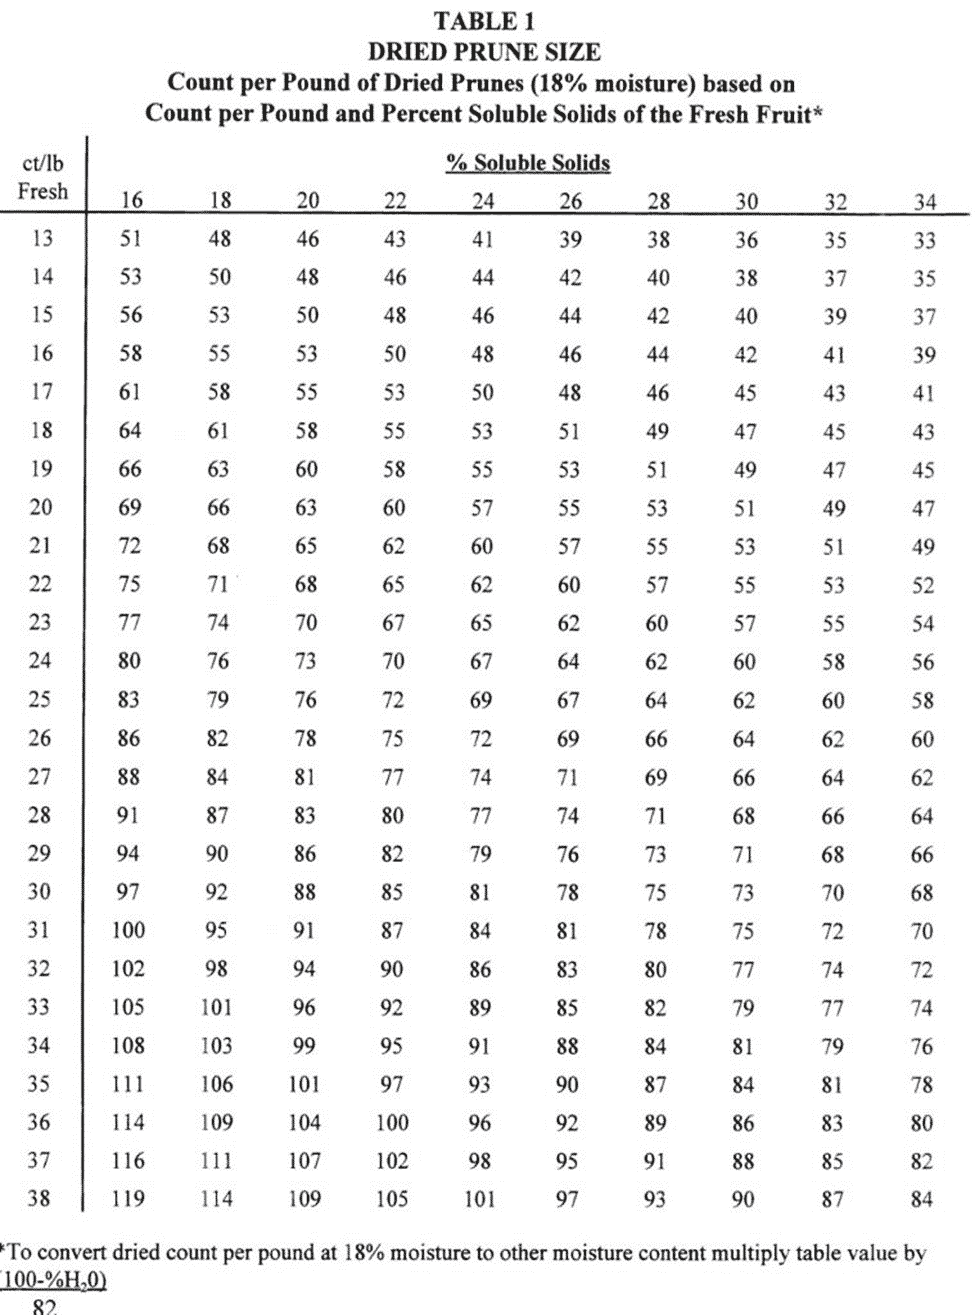
Before we get into sampling details in a particular orchard, here is a critical point. Field sizing is worth doing, but impossible to do perfectly. Why is perfect field sizing such a challenge? Fresh fruit size and fruit sugar concentration (% soluble solids) determines dry fruit size (see “Claypool Table”; Table 1). Field sizers, working properly with careful fruit flow on the receiver, drop fresh fruit of a certain diameter (assuming all the fruit has the same pressure). But sizers can’t tell individual fruit sugar levels. Fruit of the same fresh size but different sugar content will have different dry fruit sizes. That difference in fresh fruit sugar level can be the difference between a B or C screen dry fruit. For example, a medium (27 fresh fruit/lb) sized fresh fruit should make a dry fruit in the range of 71 to 81 ct/lb size (based on the Claypool Table) if the fruit had 26% SS or 20% SS, respectively. So, for that same sized piece of fresh fruit, differences in sugar level will either deliver good value or poor value to the grower. But it’s impossible to tell which will be which by fresh fruit size alone. Predicting, from field measurements, the fruit size in the orchard heading into harvest will help growers decide how aggressively they want to field size.
Field sizing is a lot like fruit thinning; there is a lot of art and experience mixed in with science. First, know what the crop looks like in your orchard. Use the Claypool Table (Table 1) to estimate the average dry fruit size in your orchard. It is very important to note that this table is not perfect and tends to be generous, predicting larger average dry fruit size for certain sugar values than actually were delivered. While it is a good estimate, the table results are anecdotally about 10% larger than what processors actually see after drying.
The following is a sampling program to estimate average dry fruit size in an orchard suggested by Bill Olson (UCCE Farm Advisor, Butte Co, retired) in a 1999 newsletter. The sampling program has been embedded in an excellent online calculator for ease of use in your orchard.
Follow these steps to estimate average dry fruit size for an orchard:
Estimate fresh fruit per pound.
- At the beginning of harvest, take several (~4) 100 fruit samples from each orchard. Each sample = 100 fruit (20 fruit from each of 5 trees). Be sure to sample both fruit clusters inside and outside of the tree at eye level.
- Weigh each fresh sample (100 fruit per sample) separately.
- Divide the number of fruit in each sample (100) by the weight of the sample (in lbs) to determine number of fresh fruit per pound.
- Average the four fresh fruit counts for the field.
Determine percent soluble solids.
- Cut 25 fruit in half from the stem to the blossom end, slicing along a flat side of the pit.
- Put all 25 fruit halves (the side without the pit) in a blender and puree the fruit.
- Squeeze fruit juice from the puree through a cheese cloth or paper towel onto a refractometer and determine percent soluble solids (sugars). *There is usually less sugar in the fruit flesh closer to the pit, so this method usually delivers a lower % SS value than if flesh from just under the skin is used.
- Average the soluble solids values for all samples for the field. *Different areas in the orchard could be harvested separately if differences in crop exist that may warrant different harvest timing.
Use the Claypool Table (Table 1, below) to predict your dry count/lb based on your average fresh count/lb and soluble solids for the orchard. Compare that average with the previous year average fruit number and P1 values for different screen sizes to get a sense of the percentage of C screen and smaller fruit in the current crop. That will help you decide how big a sizer to run. Growers who thinned in the spring should have less small fruit on the trees at harvest than if they hadn’t thinned. Please note: The “Claypool Table” was developed by Dr. L.L. Claypool (UC Davis) in the 1950’s. Recent research shows that this table can overestimate dry fruit size by an average of 10% and so should be considered only a guideline in estimating average dry fruit count/lb before harvest.
Check the results of field sizing before and during harvest. Set a chain size, and collect the fruit dropped through that chain size by placing a tarp on the ground under the sizer. Run a fresh fruit count and sugar check to compare with the Claypool Table to see, in general, what size fruit is being dropped. Adjust chain size up or down as needed in that orchard. Once harvest has started, check size and sugar of fruit dropped through the chain several times during the season. This is especially important later in the season as the fruit softens.
Finally, during harvest, make sure the belts feeding the sizing chain are run slowly enough that all the fruit is run across the sizer in a single layer — so it can be sized. If the sizing chain has too much fruit on it, all fruit will not be sized and some smaller fruit that should have dropped out will be delivered to the dryer.
ORCHARD NUTRITION
Potassium review
Franz Niederholzer, UCCE Farm Advisor; Colusa and Sutter/Yuba Counties
With the crop load largely set, the focus is now on growing the largest, best quality fruit possible. That means maintaining adequate water and nutrition up to harvest. The fruit won’t grow any faster with extra water and nutrition, but without good irrigation and proper nutrition, the fruit will be smaller and grower income less than if irrigation and especially potassium (K) is maintained at adequate levels.
Potassium (K) is the most important mineral nutrient in prune production. Potassium deficiency can mean less crop and/or smaller fruit at harvest plus more vulnerability to disease, especially Cytospora. Summer (now) is the most critical time for K nutrition. If the roots can’t get enough K from the soil to support fruit growth, the needed K is taken from leaves resulting in potassium deficiency symptoms (yellowing leaves), reduced photosynthesis and smaller fruit. In cases of extreme K deficiency, trees can die after harvest due to leaf loss, root starvation and salt poisoning. Severe potassium deficiency also can create a cascade of trouble [yellow leaves –> early leaf drop –> sunburned wood –> Cytospora infection.]
With stakes like these (grower income, orchard health), maintaining good K fertility/nutrition should be one of the top concerns for growers looking to maximize returns. The following is a review of the 4R’s of K management in prunes.
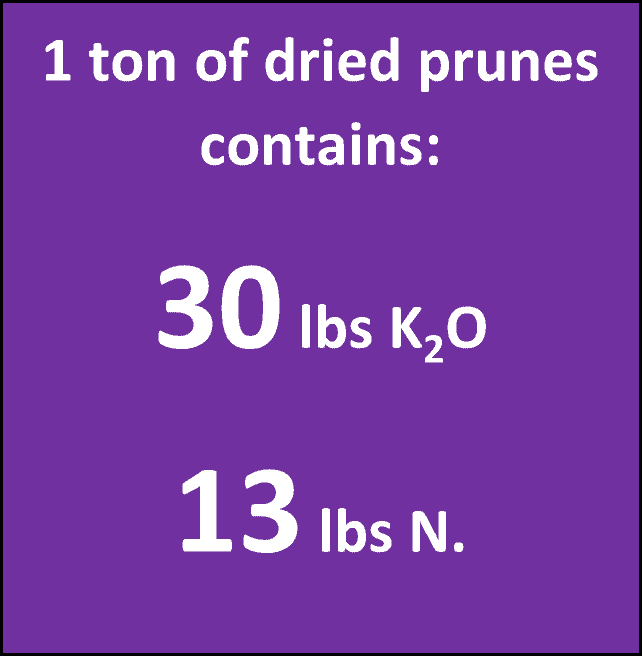
Right rate: The minimum annual K nutrient budget should be equal to the K used by the crop that year. A dry ton of prunes contains roughly 30 lbs of K2O. Clay soils hold K on the surface of clay minerals and organic matter, so fertilizing crops on loam to clay soils often requires high rates of K fertilization to satisfy soil and crop.
What about foliar K? A “foliar only” program of 4 x 25 lbs potassium nitrate per acre per year (4 sprays/year) can be as effective as 600 lbs fall soil applied MOP (potassium chloride) in maintaining leaf K levels in a high producing, flood irrigated prune orchard (early 1990’s research). While foliar K keeps good nutrition in the trees, it’s a “band-aid program”, not a long-term, sustainable program for K nutrition. Why is that? 100 lbs potassium nitrate = 45 lbs K2O while a 3 dry ton prune crop uses 90 lbs K2O /acre; that means half of the crop’s K came out of the “soil K bank”. That’s a net loss to the soil that will have to be “paid off” with extra fertilizer in the future to avoid reduced soil K availability over time.
Right timing: Prune fruit use K at a steady pace through the growing season, but K is harder for the roots to “find” in the summer when root growth slows as fruit growth gets most of the tree’s energy. Fall application of dry potassium banded or broadcast under micro-sprinklers costs less for material (dry fertilizer) per acre compared to fertigated K (at the same rate of K2O per acre) during the growing season. Fall K application is a “blind” investment as the crop set in March determines how much K is really needed that season. On the other hand, soils hold unused K for another year. Some growers hedge their best by splitting the annual K fertilizer rate and applying half as less expensive dry material (SOP or MOP) and the second half in the growing season via fertigation (using ultra-fine SOP thru a gyp machine, liquid KTS, potassium carbonate, etc.).
If fall soil K application wasn’t done or the rate reduced, make sure enough K is available to the trees by fertigation (delivery of K to the roots with irrigation water) and/or foliar fertilization with potassium nitrate or equal amount of K2O in another formulation.
Right location: Potassium is relatively immobile in soils, so the fertilizer K should be delivered as close to active roots as possible. If using drip irrigation, band dry K near the drip hose where irrigation water reaches or fertigate through the drippers. If using microsprinklers, put the dry material where the irrigation water will reach or inject K through the sprinklers. Injecting K through full coverage sprinklers is very inefficient – less of the fertilizer will end up in the trees compared to locally applied fertilizer.
Right material: All K fertilizers are water soluble and deliver good tree nutrition when applied near roots. Some forms are more convenient, some provide extra amendment or nutrient value. Prices vary 100% based on form and chemistry.
***************************************************************************************
Five major potassium fertilizer materials (in different forms), concentration in the commercial product(s), advantages/disadvantages and how much on a weight basis (for dry or liquid product) equals the K content of 4 dry ton/acre (30 lbs K20/ton of dry fruit).
| Fertilizer | N-P-K conc | Pro/con | Fertilizer weight needed to equal 120 lb K2O*? |
| Potassium chloride (MOP; muriate of potash) | 0-0-60 (dry) 0-0-12 (liquid) | Beware of chloride w certain rootstocks (Lovell peach, K86) | 200 lb (dry) 1000 lb (liquid) |
| Potassium sulfate (SOP; sulfate of potash) | 0-0-48 (dry: coarse or ultra-fine) 0-0-8 (liquid) | Safe, non-reactive (won’t change pH). Contains essential nutrient sulfur. Ultra- fine can be fertigated using a “gyp machine”. | 250 lbs (dry) 1500 lbs (liquid) |
| Potassium thiosulfate (KTS) | 0-0-25 (liquid) | Stable liquid K source. Contains sulfur. Lowers soil pH | 480 lbs (liquid) |
| Potassium carbonate (pot carb) | 0-0-30 (liquid) | Stable liquid K source. Increases soil pH | 400 lbs (liquid) |
| Potassium nitrate | 13-0-45 (dry) | Very soluble, excellent foliar feed material | 267 lb (dry)** |
Overall K strategy:
Keep leaf K in the range of 1.3-2.0% in July. Leaf K less than 1% is deficient and will reduce yield and fruit size.
Don’t sleep on K for your orchard(s). It could cost you!
NEW ORCHARD ADVISOR JOINS UCCE SAC VALLEY TEAM
 My name is Becky Wheeler-Dykes and I am thrilled to join UC Cooperative Extension as the new Orchard Systems Advisor serving Glenn, Tehama and Colusa Counties. I’ll be based in Orland at the Glenn UCCE Office. As an Orchard Crops and Weed Ecology Advisor, I’ll be covering olives, prunes, walnuts and almonds as well as emphasizing weed management research in these cropping systems. I grew up on a small prune and walnut farm in Gridley and am happy to be settling down near family. After completing my undergraduate degree in Crop Science and Business Management at UC Davis, I continued on for my Masters in Entomology, where I focused on IPM in orchards. I have since worked in ag research in several crops and disciplines, and I’m excited to bring those experiences to the Sac Valley as the newest Farm Advisor.
I hope to spend the first few months getting to know the growers, producers, and ag community of our beautiful region. I look forward to learning from and with you all, and I can’t wait to build a research program to support your unique needs in Glenn, Tehama and Colusa Counties. Please give me a call to come out and troubleshoot problems in the field, learn about the challenges you face in agriculture, or just get to know you and your orchards! I can be reached by email at bawheeler@ucanr.edu or telephone at 530-865-1152.