Orchard Notes: May 2020
Spring & Early Summer Orchard Considerations
Luke Milliron, UCCE Farm Advisor, Butte, Glenn and Tehama Counties
Franz Niederholzer, UCCE Farm Advisor, Colusa, Sutter and Yuba Counties
Katherine Jarvis-Shean, UCCE Farm Advisor Sacramento, Solano & Yolo Counties
May
- Irrigation: Monitor tree moisture status (using the pressure chamber), soil moisture and/or tracking ETc to manage irrigation. May and June are the most critical months for end-cracking, which occurs when dry orchards are irrigated. Stay on top of orchard water status since irrigation is critical during the spring. Valuable, free publication on using the pressure chamber in nuts and prunes is available at: edu/datastoreFiles/391-761.pdf
- Fertility: Continue with nitrogen and potassium fertilization program if a good crop is set. More than 50% of annual N budget should be applied before June 1st.
- Aphids: While monitoring for leaf curl plum aphid comes to an end in mid-May, continue monitoring for mealy plum aphid until mid-July.
- Rust: Monitoring commences with the start of the month, surveying 40 trees every 1-2 weeks. Pay close attention to non-bearing replants, exceptionally vigorous trees, and previous hot spots. Consider treating when the first leaf with rust is found. For more on rust see: ucanr.edu/PMG/r606100611.html
- Peach twig borer (PTB) and Oblique-banded leaf roller (OBLR): These worms feed on the fruit surface later in the season, “opening the door” for fruit brown rot infection as sugar increases in the fruit. Don’t assume earlier sprays worked to control these pests. Inspect fruit at 400 degree days after the first PTB biofix. In the orchard, look for larval entry points on the fruit (ideally 15 fruit from 80 trees), especially where fruits contact each other or touch leaves. Treat if 2% or more (24+ of 1,200) of the fruit have damage. For OBLR, begin fruit inspections at 930 degree days after biofix for that pest, following the same sampling protocol and treatment threshold. More on PTB at: ucanr.edu/PMG/r606300211.html and on OBLR at: ipm.ucanr.edu/PMG/r611300511.html
June
- Irrigation: Continue monitoring soil and/or trees to maintain adequate orchard water status.
- End cracking risk continues in June if the orchard is severely water stressed and then irrigated. This is much more of a problem with flood irrigated compared to micro-irrigated (sprinklers or drip) orchards.
- Side cracking can be a significant problem during rapid fruit expansion in late June to mid- July, especially in lightly cropped orchards with large average fruit size. See additional information below.
- Continue monitoring for aphids and rust.
- Spider mites: Begin scouting by checking two different sections of the orchard each week. Spend about five minutes in each section checking 2-3 leaves (some inside and outside of the canopy) on 10 trees. Look for spider mites and predators (predaceous mites and sixspotted thrips). Treatment decisions should be based on population levels of both mites and predators. If more than 20% of leaves have mites, but less than 50% of the leaves have predators, treat for mites. If more than 60% of leaves have mites, treat even if most leaves have predators. For more on mites, see ucanr.edu/PMG/r606400411.html
July
- Irrigation: Monitor soil and/or orchard moisture to avoid increased end- and/or side- cracking until mid-July. The suggested target for mid-day stem water potential (SWP), measured with a pressure chamber, is -12 bars in July. Rapid fruit growth slows by the second half of July and the risk of fruit cracking decreases.
- Aphids, rust, and spider mites: Continue monitoring for late summer (preharvest) outbreaks of rust and/or spider mites. Infestations of these pests can cause leaf drop at harvest, slowing conveyor and elevator belts at harvest in order to better blow out the leaves and keep the bins clean.
- Brown rot: Consider preharvest treatments for brown rot according to UC IPM guidelines: ucanr.edu/PMG/r606100911.html. See timings and material efficacy at: ipm.ucanr.edu/PDF/PMG/fungicideefficacytiming.pdf. If planning a fruit brown rot spray, consult with your packer regarding any market limiations on fungicide selection.
- Monitoring Fruit Maturity: When color just begins to show along the suture, fruit should be mature in roughly 30 days. Begin measuring fruit internal pressure once fruit shows color. Warmer weather slows fruit maturity; cooler weather = faster fruit maturity. Fruit lose 1 to 2 lbs fruit pressure per week and are mature at 3 – 4 lbs internal pressure.
- July leaf samples: To help evaluate your nutrient program this year, collect leaves from non-fruiting spurs from representative trees and submit to a lab for analysis. Leaf sampling details at: com/prunes/horticulture-prunes/july-leaf-sampling-a-critical-task-in-prune-production/
- PTB, OBLR, San Jose Scale, and brown rot: Sampling for damaged fruit just ahead of harvest will give you an indication of the efficacy of your IPM program. Randomly examine 1000 fruit (40 from 25 trees) looking for larvae, worm damage, and halo spots caused by San Jose scale. More information is available at: ucanr.edu/PMG/r606900711.html
- Clean up orchard ahead of harvest: Cut out broken limbs and dead branches and remove them from the orchard ahead of harvest. This will reduce the risk to the harvest crew from flying dead wood during shaking and chances of canvas tears and other glitches that can slow harvest.
Prune Fruit Cracking
Franz Niederholzer, UCCE Farm Advisor, Colusa, Sutter and Yuba Counties
Fruit skin cracking results in off-grade fruit that can easily be infected with brown rot. There are two general kinds of fruit cracking: side-cracking and end-cracking. Each is caused by different combinations of similar fruit growth and environmental conditions and requires different practices to manage.
Prune fruit growth drives fruit cracking. Prune fresh fruit goes through a rapid, final expansion from late June through early July, on average. Once that volume growth is finished, roughly by mid-July, the fruit only grows in dry weight as sugar increases; there is no more fresh fruit size growth. Rapid fresh fruit growth lasts about three weeks and can be tracked by comparing fruit diameter from cheek-to-cheek vs suture-side.
End-cracking: When water stressed orchards are irrigated in June through mid-July, the rapid fruit rehydration increases internal pressure at the tip end (away from the stem end) of the fruit faster than the fruit skin can stretch and splitting occurs. Maintaining adequate orchard moisture through the spring and early summer (May and June) is the key to reducing end-cracking. After mid-July, re-irrigating dry orchards does not increase end-cracking.
Side-cracking: Sun-exposed prune fruit skin is less elastic than shaded skin. During the roughly 3 weeks of rapid fresh fruit growth in late June/early July, skin side-cracks form on the sun exposed side of fruit during cool nights with high humidity. The fruit skin absorbs moisture from the humid air and cracking occurs, driven by the internal pressure of the expanding fruit. Once the rapid fruit growth period has passed, so has the risk of side-cracking. Lighter crops, with a tendency towards larger fruit size, commonly see more side-cracking than heavier crops with smaller fruit sizes.
To reduce side-cracking as much as possible, there are several factors to consider and attempt to manage. A key monitoring tool is fruit diameter, both cheek and suture. When fruit cheek diameter exceeds suture diameter, rapid fruit growth and side-cracking risk is a week away. Good vegetative growth from adequate irrigation and nutrition management provides more shading for fruit that under poor vegetative growth conditions. Mild orchard water stress as rapid fruit growth timing begins reduces side-cracking. Reducing or delaying irrigation, especially flood or wide-coverage sprinkler irrigation, as rapid fruit growth begins can reduce orchard humidity and fruit end-cracking. However, sudden weather shifts from hot to cooler can’t be managed and will promote higher humidity at night and a greater risk of end cracking. Attention to all these factors will help reduce losses to fruit side-cracking.
In a difficult marketing year, delivering a good quality crop is essential to maximizing grower income. Careful attention to irrigation amounts and timings as well as fruit growth patterns through June and into July can help reduce fruit cracking and grower income losses.
Update on Rootstocks for Prune Production
Luke Milliron, UCCE Farm Advisor, Butte, Glenn and Tehama Counties
Two rootstock experiments in grower orchards were planted in Northern California in 2011. One site in Butte County and a second in Yuba County. The two sites are evaluating the performance of Improved French on 14 rootstocks planted in replicated randomized trials. The sites share five standard rootstocks that already had widespread adoption in the industry, namely Myroblan 29C, Myroblan Seedling, Marianna 2624, Marianna 40, and Lovell. The sites also share eight test rootstocks, Krysmsk 86, Krysmk 1, Viking, Atlas, Citation, HBOK 50, Marianna 30, and Marianna 58. Rootpac-R is only at the Yuba location, and Empyrean 2 is only at the Butte location.
The Butte site was previously planted to almonds on Lovell rootstock, while the Yuba site is prune following prune. The Butte site is a Farwell clay adobe alternating with a lighter textured Nord loam, while the Yuba site is Kilga clay loam. The Butte site received no pre-plant fumigation, while the Yuba site had Telone fumigation. Following late planting during a wet spring, there were extensive replants in 2012 at both sites. At the Butte site, replants benefited from spot fumigation with 0.5 pounds of chloropicrin. The Butte and Yuba sites are irrigated with drip and micro-sprinkler, respectively. Finally, the Butte site is 12.5 feet in-row and 17 feet between rows (205 trees/acre), and Yuba is 16 feet in-row and 18 feet between rows (151 trees/acre). We previously reported in this newsletter on the results from this trial in 2016 and 2018 issues.
Rootstock survival:
Although the vigor imparted by the rootstock is an important consideration, survival in adverse conditions is the most valuable benefit a rootstock can impart (Table 1). Percent tree survival was assessed at both sites in 2019 and survival ranged from 10% (Empyrean 2) to 97% (Atlas) at the Butte site, and 37% (HBOK 50) to 100% (Viking and Lovell) at the Yuba site (table 2). There are notable differences and similarities in survival between the two sites. Myrobalan 29C, Myrobalan seedling and HBOK 50 have all had higher numerical survival rates at the Butte site than at the Yuba location where bacterial canker created significant tree losses, potentially due to bacterial canker susceptibility at the Yuba location (photo 1). It is unclear why Lovell, Krymsk 86, Citation, and Krymsk 1 have had numerically higher survival at the Yuba location. At both sites Atlas and Viking, which were planted a year later and in the case of the Butte site received spot fumigation before planting have had excellent survival (97-100%). Marianna 40 and Marianna 2624 have also had good survival (80-87%). Marianna 58 has had intermediate survival performance at both sites (73% and 77%). Finally, Marianna 30 has had very low survival at both sites (43% and 37%)
% Tree Survival, 2019 |
||||||
| Rootstock | Butte | Rootstock | Yuba | |||
| Atlas | 97% | a | Viking | 100% | a | |
| Viking | 93% | a | Lovell | 100% | a | |
| Myro. | 93% | a | Atlas | 97% | a | |
| M29C | 90% | ab | K86 | 97% | a | |
| M40 | 86% | ab | Root.-R | 93% | a | |
| M2624 | 80% | ab | M40 | 87% | a | |
| K86 | 77% | ab | M2624 | 83% | a | |
| HBOK50 | 77% | ab | Citation | 80% | a | |
| M58 | 73% | ab | K1 | 80% | a | |
| Lovell | 70% | ab | M58 | 77% | ab | |
| Citation | 53% | abc | Myro. | 73% | ab | |
| M30 | 43% | bc | M29C | 63% | ab | |
| K1 | 43% | bc | M30 | 37% | b | |
| Emp. 2 | 10% | c | HBOK50 | 37% | b | |
| Average | 70% | Average | 79% | |||
Table 1. Percent tree survival at the Butte (7 September) and Yuba (12 June) sites in 2019. Values followed by the same letters are not significantly different at 95% using Tukey’s HSD.
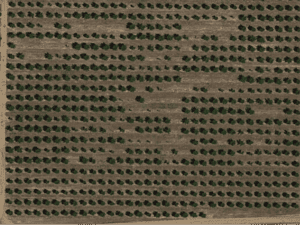
Photo 1. Satellite image of the UCCE prune rootstock plot (inside the blue line) in Yuba County showing differences in tree size and survival between different rootstocks. Although tree loss was likely from multiple causes, bacterial canker was a significant player. Each rootstock is planted in six tree groups down the rows running E-W. Note gaps of six trees show where a particular rootstock failed, adjacent to large, healthy canopies where a different rootstock is thriving. The grower’s trees, outside the blue line are all on M40. (Google©, Imagery Maxar Technologies ©2019, and U.S. Geological Survey map data ©2019).
Rootstock vigor:
The 2018 article includes discussion of relative vigor, potential nematode and crown/root rot susceptibility, as well as early assessments of rootstock bloom timing at Butte, canker and tree loss at Yuba, and the 2017 trunk size and yield results. You can find the full discussion of these preliminary findings at sacvalleyorchards.com/blog/prunes-blog/preliminary-observations-for-new-prune-rootstocks
Generally, larger trunks = larger, more vigorous trees with greater yield. Trunk diameter (in) for 2019 is shown for 2019 in Table 2. Myrobalan 29C and HBOK 50 had the largest diameter at the Butte and Yuba sites, respectively. The rootstocks imparting among the greatest vigor according to diameter at both locations were Myrobalan 29C, Viking, Atlas, Krysmk 86, and Lovell. Krymsk 1 had the smallest diameter at both sites. In addition to Krymsk 1; Marianna 58, Empyrean 2, Citation, and Marianna 2624 imparted the least vigor according to diameter. In general, trees were larger at the Butte site than in Yuba.
Trunk diameter (in), 2019 |
||||||
| Rootstock | Butte | Rootstock | Yuba | |||
| M29C | 7.1 | a | HBOK50 | 5.5 | a | |
| Atlas | 6.5 | ab | Viking | 5.3 | ab | |
| Viking | 6.3 | ab | Atlas | 5.3 | ab | |
| M30 | 6.1 | ab | K86 | 5.0 | abc | |
| Lovell | 5.9 | abc | M29C | 4.7 | abcd | |
| M40 | 5.4 | abcd | Lovell | 4.6 | abcde | |
| K86 | 5.3 | abcd | M30 | 4.5 | bcde | |
| Myro. | 5.2 | bcd | M40 | 4.3 | cde | |
| M2624 | 5.0 | bcde | Root.-R | 4.0 | def | |
| Citation | 4.9 | bcde | M2624 | 3.8 | ef | |
| HBOK50 | 4.0 | cde | Myro. | 3.8 | efg | |
| Emp. 2 | 3.9 | cde | Citation | 3.4 | fg | |
| M58 | 3.8 | de | M58 | 3.0 | gh | |
| K1 | 2.9 | e | K1 | 2.3 | h | |
| Average | 5.2 | Average | 4.3 | |||
Table 2. Trunk diameter (in) at the Butte and Yuba sites in 2019. Values followed by the same letters are not significantly different at 95% using Tukey’s HSD, with letter order denoting highest to lowest.
Yield has been much more variable at the two sites. Together with TCSA, yields have been numerically higher at the Butte site. The exception of this was 2018, following potential over cropping in 2017 at the Butte site and poor return bloom density in 2018. Unlike TCSA, yield differences by rootstock have not been consistent at each site, year-to-year. However, Krymsk 1 has been amongst the lowest yielding rootstocks at both sites for every harvest. More harvests are needed to more clearly define yield differences between the rootstocks. Despite this variability, it has been true that generally yield increases with increasing TCSA (table 1).
When interpreting these yield results, it’s important to consider that all rootstock trials that impose the same spacing across the plot disadvantage lower vigor rootstocks that could have been placed at a higher density. Although yield generally increases with increasing tree size, there are some rootstocks that yield particularly well or poorly for their size. In 2019 at the Butte site, for example, Marianna 2624 and Marianna 30 had the highest yield efficiency, Empyrean 2 had the lowest and all other rootstocks fell in-between. Again, more harvest data is needed to enumerate which rootstocks are over- and under-yielding for their TCSA. Some growers with an interest in lower vigor inducing rootstocks are beginning to trial high density plantings.
To see the complete yield, fruit size, bloom timing and density, leaf mineral nutrition, and tree water status results for this trial you can find the 2019 report at: ucanr.edu/sites/driedplum/files/318583.docx
Rootstock suckers and anchorage:
In the 2016 article on early observation from the two rootstock sites we focused on rootstock suckers and anchorage. Rootstock suckering was evaluated on a rating of 0-4, where trees with a “0” had no suckers at all, “1” had at most only a couple of very small suckers, to “4” where suckers were both numerous and large. At both sites Myroblan seedling had the highest sucker rating, while Atlas, HBOK50, Viking, Citation, Marianna 58, Krysmk 86, Lovell, and Marianna 40 all were rated below a 0.5 at both sites. Anchorage was evaluated by measuring the degrees of lean from vertical when each tree was pushed with an equal force. There was much more lean at the Yuba site, which is on a Kilga clay loam, over hard pan where soils were wet at the time of evaluation. However, at both sites Krymsk 1, Marianna 58, HBOK 50, and Citation average above 4% lean. At both sites, Krymsk 86 and Viking averaged the least lean. In these evaluations of suckering and anchorage, Krymsk 86 and Viking had among the best performance at both sites. You can see the suckering and anchorage results at: sacvalleyorchards.com/blog/prunes-blog/prune-rootstock-trial-performance